Anaplan Practice Project
You can view his video that showcases the full project and then take a look through his step-by-step process to better understand how Anaplan can work.
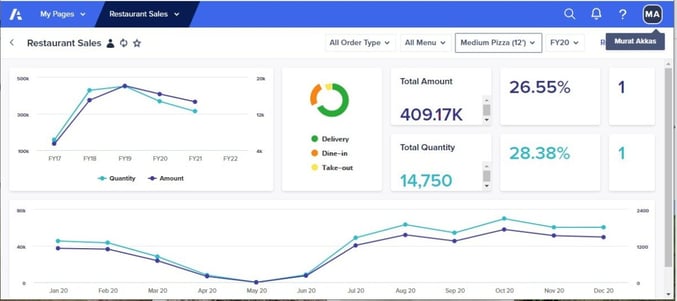
Go Through the Project Steps with Murat
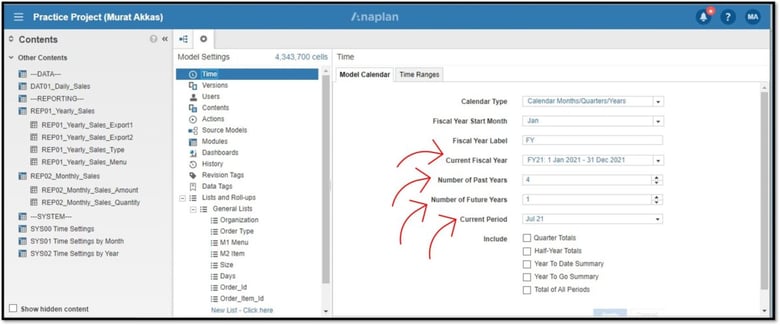
First, I extracted the restaurant sales data of an authentic pizza company branch from an SQL database. Second, I have transformed the transactional data into aggregated daily data grouped by menu category, item, size, and order type. I then exported this data to a csv file. The data covers the beginning of 2017 to the end of June 2021. The transactional data has 248,365 rows, and the daily aggregated data has 137,520 rows. I created a new model in Anaplan and set the model calendar as shown in the image below:
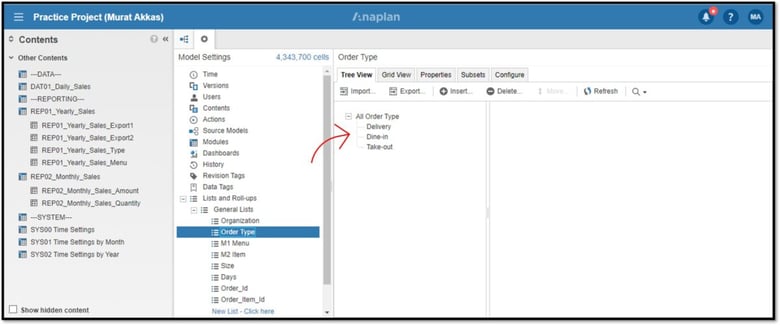
This particular restaurant offers three types of services: dine-in, take-out, and delivery. I have added an order type list and load the types of services as list items.
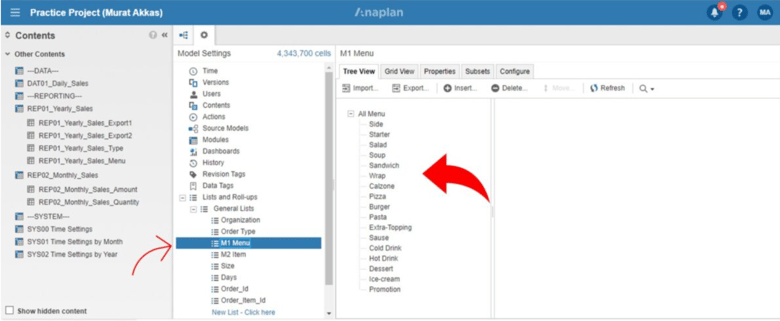
There are hundreds of menu items, so I created a hierarchical list for menu categories and items.

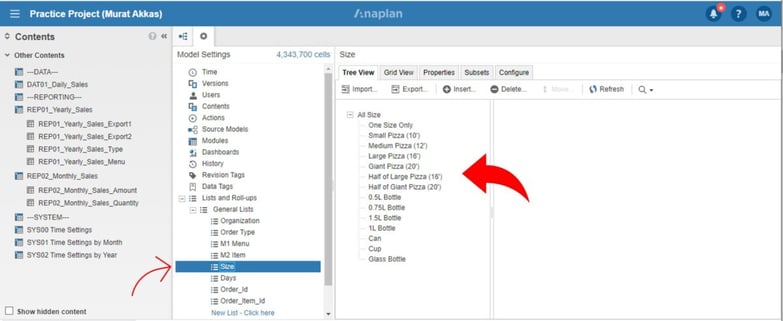
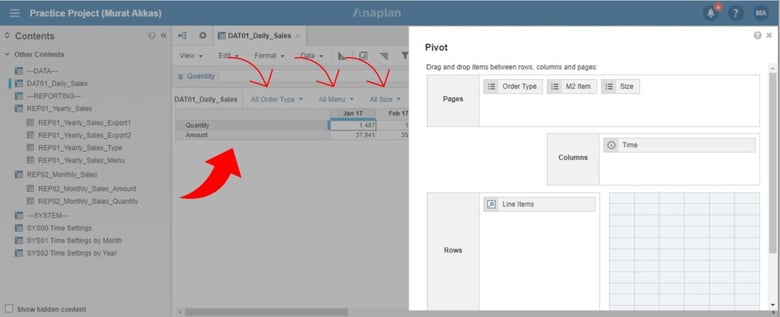
I created a data module to import the csv data file. Order type, menu item, size, and time are the dimensions of this module. On the other hand, this module has two-line items: one for quantity of sales and one for amount of sales.
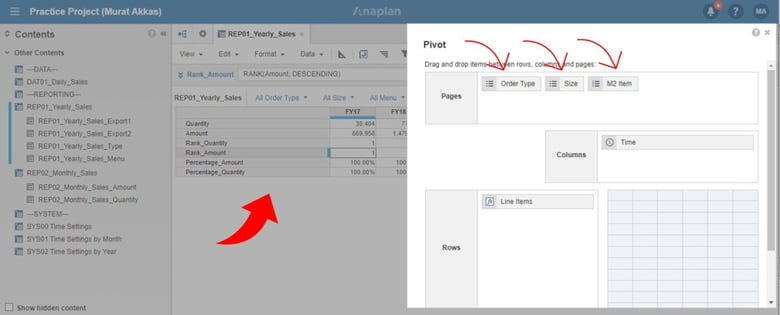
After having loaded the csv file into data module, I created another module to calculate the rank and percentage as line items for both quantity and amount.


.png)
.png?width=352&name=Sales%20Capacity%20Planning%20(2).png)


